FIBRE CHANNEL PERFORMANCES WITH IBM EQUIPMENT
First type of load (large messages)
Performances issued from the load processes were constantly checked during the test and as no drop has been noted, they are not represented.
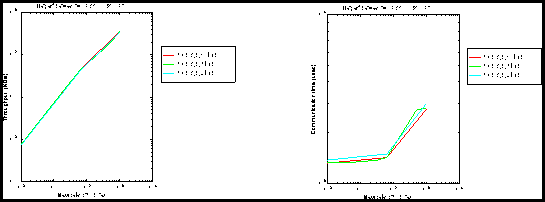
Figures 6 and 7 (left) display the performances for transferring data from memory to memory versus the message length, according to the number of loads. The socket buffer size for this test was set to 1 Kbytes.
Figures 7 (right), 8, 9 and 10 display the performances for writing data on the sender side versus the message length, according to the number of loads. For small messages (less than 1Kbytes), the socket buffer size was set to 1 Kbytes. For large messages, the socket buffer size was set to 1 Mbytes and the -D option was set off.

Figure 6: From memory to memory: (left) Throughput, (right) Communication latency.
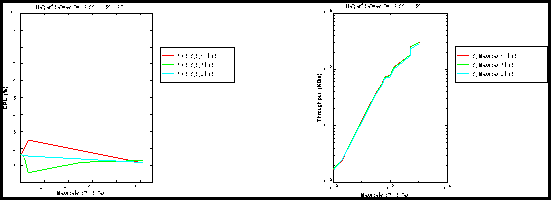
Figure 7:(left) CPU (From memory to memory), (right) Throughput (small messages).
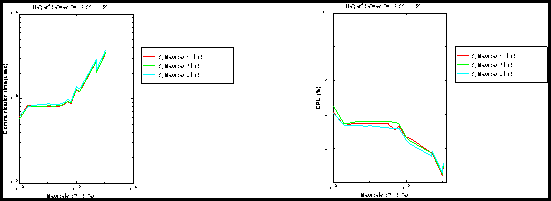
Figure 8: (left) Overhead (small messages), (right) CPU (small messages).
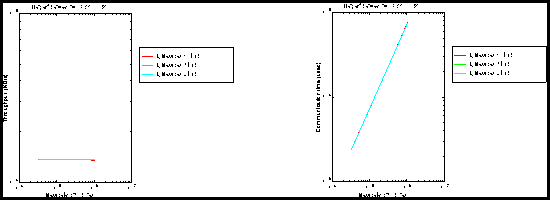
Figure 9: (left) Throughput (large messages), (right) Overhead (large messages).
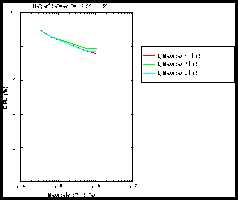
Figure 10: (CPU) (large messages).
The load, when it consists in sending large messages, does not degrade the performance on other communications, as long as these communications are made of large message exchanges. When they are made of small message exchanges, a small degradation (few percents) has been reported. As this degradation is weak, it is difficult to be sure that this is not resulting of statistical fluctuations.
Second type of load (small messages)
Figures 11 and 12 (left) display the performances for transferring data from memory to memory versus the message length, according to the number of loads. The socket buffer size for this test was set to 1 Kbytes.
Figures 12 (right), 13, 14 and 15 display the performances for writing data on the sender side versus the message length, according to the number of loads. For small messages (less than 1Kbytes), the socket buffer size was set to 1 Kbytes. For large messages, the socket buffer size was set to 1 Mbytes and the -D option was set off.
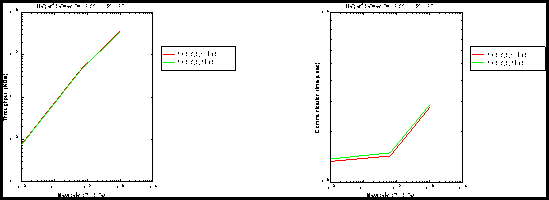
Figure 11: From memory to memory: (left) Throughput, (right) Communication latency.
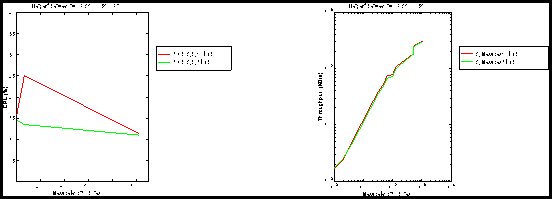
Figure 12:(left) CPU (From memory to memory), (right) Throughput (small messages).
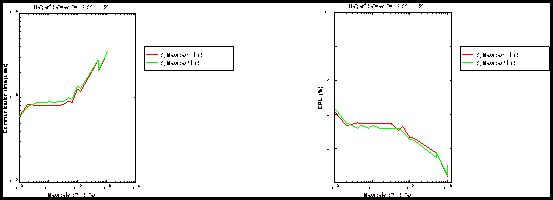
Figure 13: (left) Overhead (small messages), (right) CPU (small messages).
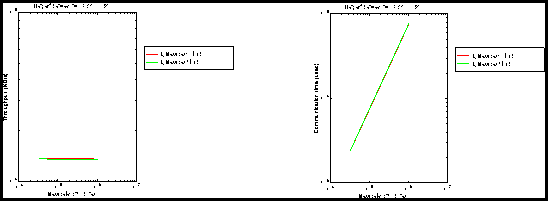
Figure 14: (left) Throughput (large messages), (right) Overhead (large messages).
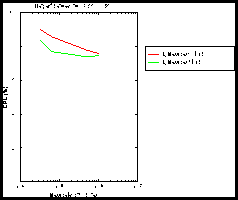
Figure 15: (CPU) (large messages).
Figure 16 displays the degradation that has been reported on the load communications, versus the duration of the test, according to the type of test that was running in parallel.
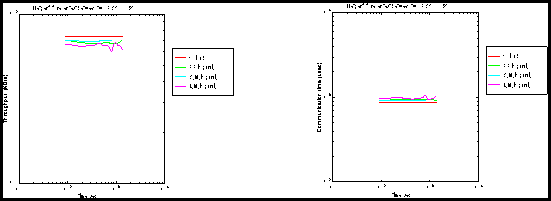
Figure 16: (left) Throughput on the load, (right) Overhead on the load.
When the load is made of the transmission of small messages, we pointed out a degradation on all communication performances of around 5-10 percent.
Generated with CERN WebMaker